Decrease Web Page Load Speeds – 7 Free Tools Reviewed
 Page load times are more critical than ever. People want instant access to everything – paying bills, shopping, reading articles, watching videos, etc. If there’s any delay, we’re on to something else – or we’re just disappointed.
As overall page speeds have increased over the years, our attention spans have become shorter.
To prove that theory, in 2017, Google analyzed 11 million mobile ads’ landing pages across 213 countries. Their results revealed that as page load time increases from 1 second to 5 seconds, the probability a user bouncing increases 90 per cent. Additionally, they discovered as the number of elements on a page, such as images, titles, and text, increases from 400 to 6,000, the probability of conversion drops 95%! So, speed isn’t everything, but it’s a big part of the puzzle.Speed is relative to the actual user – physical location, device, browser, and connection must be taken into consideration, which is why it’s a great idea to take advantage of these free tools to confirm what your visitors are seeing. Not only that, faster load times benefit from better SEO rank, engagement, and conversion rates. Who doesn’t want that?
1. Dotcom-Monitor
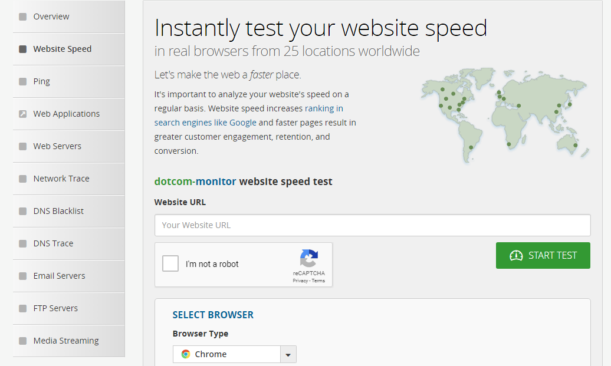
One of the most popular tools on the market, Dotcom-Monitor offers a full suite of free web performance monitoring tools. The free website speed test tool from Dotcom-Monitor allows you to simultaneously test your website’s speed from 25 locations in seven regions, including cloud-based (AWS US-East) and from behind the Great Firewall of China (Shanghai). In addition, you can select from seven desktop and mobile browsers- Android, Blackberry, Chrome, Firefox, Internet Explorer, iOS, and Windows Phone. By default, the test also runs a repeat visit to simulate a return visitor to show how the browser performs if it already has cached certain page elements.
Once a test is complete, you can select ‘View Waterfall,’ to view the detailed summary, waterfall chart, error details, hosts, and fastest/slowest elements. Users also have the option to send a PDF or CSV version of the report to anyone they’d like.
2. GTmetrix
 The free site analyzer from GTmetrix provides information on page load details across several factors. The report is divided into six categories – PageSpeed, YSlow Score (from F to A), Waterfall Charts, Page Load Timings, Page Load Video and Filmstrip and Report History. In addition to the overall performance scores and details, users can drill down into more granular recommendations, as well as download a PDF version of the report.
Note: Access to additional features, such as creating page load videos and filmstrips, testing from multiple locations, and testing from a mobile device, require users to create an account.
3. Uptrends
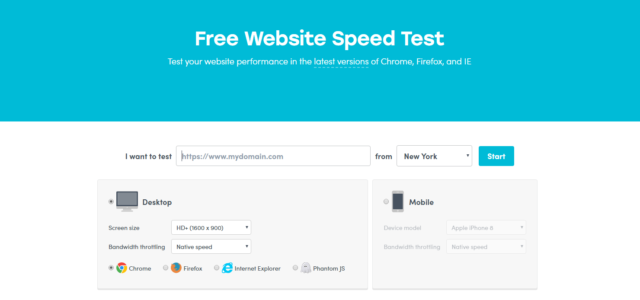 The free website speed test from Uptrends allows users to test their site from nine locations in seven countries, in addition to selecting from four browsers (Chrome, Firefox, Internet Explorer, and Phantom JS), 25 mobile browser/devices (iOS, Android, Amazon Kindle, etc.), and bandwidth options (Cable, Fiber, 3G/4G, etc.). Results are broken into three sections – General Information, Performance Improvement (with suggestions) and waterfall charts (Object Types, Object Bytes, Response Codes, and Used Domains).
Note: In order to take advantage of their synthetic monitoring from their 184+ global locations, users must create an account.
4. Pingdom
 Using the free website speed test from Pingdom, users can choose from one of five locations in three countries to test their page load times. All tests are performed with real web browsers. After the test finishes, users receive a summary of the results, along with performance insights/suggestions (graded F to A), content and domain breakouts, and waterfall charts. Users can also download a HAR version of the report or share the results.
Note: To test from their additional 70+ locations, users must create an account.
5. Dareboost
Dareboost uses real browser testing services (Chrome) to run their website speed test. Their free tool only allows you to run one test from one location. Subsequent tests require the user to create an account. After the test is complete, users can review the quality and performance reports. Broken out by three categories – Issues, Improvements, and Successes, users can drill into specific results (by various categories) and get recommendations to issue resolution. A Visual Metrics option allows users to playback, and select from five different playback rates, to view the page rendering from start to finish.
Note: There is an option to download a report, but users must create an account. Also, Dareboost offers a separate mobile website speed test option, but users must sign up for an account to access that testing option.
6. WebPageTest
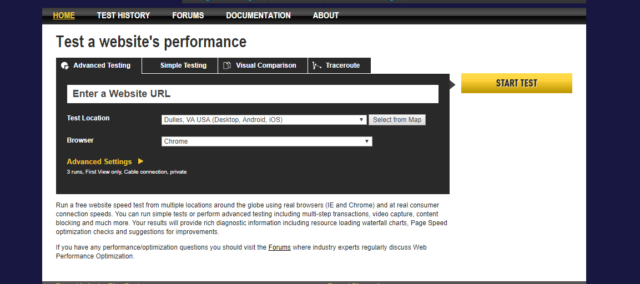 The website performance test from WebPageTest gives users a couple of different options – a simple test or an advanced test. By default, the simple test is set up to run three tests from a single location (Dulles, Virginia) and users can select to test from mobile (3G/4G) or desktop configurations, include a repeat view, or run a Lighthouse audit.
Like the simple testing option, the advanced testing option runs three tests by default, but users have the option to select up to nine. Additionally, the advanced option gives users more features to pick and choose from, such as connection speeds, disabling JavaScript, ignoring SSL Certificate errors, capturing full-size filmstrip video, and more. Users can choose from Android and Apple devices, as well as desktop options (Chrome, Firefox, Internet Explorer, Opera, etc.) in multiple countries and locations throughout North/South America, Europe, Africa, Middle East, Asia, and Oceania.
Once the test runs complete, a summary of the statistics and grade for the overall performance of your page (graded F to A) is provided along with waterfall charts, content and processing breakdowns, and image analysis. Users also have the option to view video/filmstrip, download the raw page data, export as a HAR file, and view the test log.
7. Keycdn
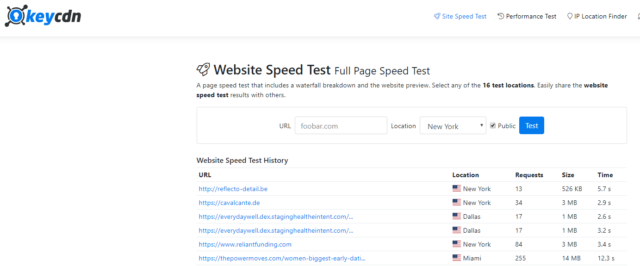 The website speed test from KeyCDN allows users to test their URL from one of 16 locations in 12 countries, with the option of making the results public (for sharing with others) or keeping them private. Once the test is complete, a waterfall chart is displayed, showing users the number of HTTP requests, size of the page, and total load time. In addition, a preview of the page is shown at the bottom under the results.
Summary
Having tested the top 7 tools listed above it is obvious that each brings its own benefits. For those who need to see their page speed in lots of different locations then DotCom Monitor is the best all-round. To get quick precise data then Pingdom does the trick and if you are a stickler for large amounts of data you can delve into in order to find out exactly what is taking your site so long to load up, then WebPageTest is as reliable and easy to use as ever.


